
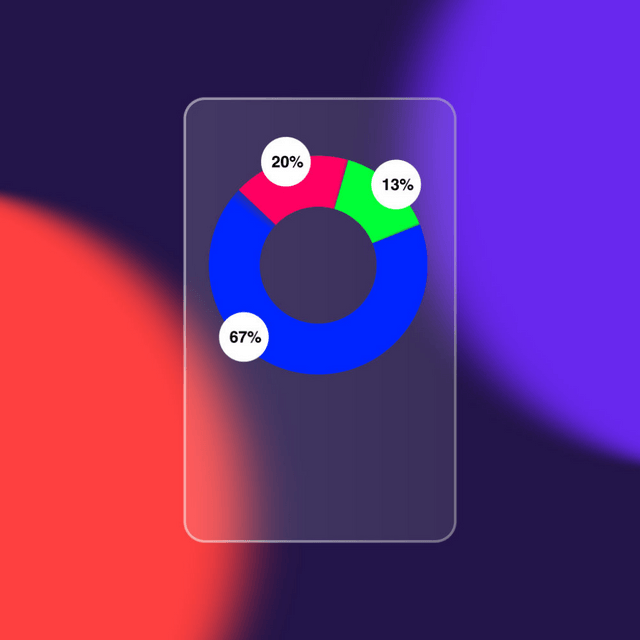
Kostenlose Pie Chart Glass Morphing Animation
A pie chart is a circular statistical graphic that is divided into slices to illustrate numerical proportions. Each slice of the pie represents a category's contribution to the whole, and the size of each slice is proportional to the quantity it represents. Key Features of a Pie Chart: Shape: Circular. Slices: Each section (or slice) represents a part of the total. Percentage or Value: Often labeled with percentages or exact values. Total: Represents 100% of the data set. When to Use a Pie Chart: To show relative proportions or percentages of a whole. To compare parts of a single data series. When you have a limited number of categories
A pie chart is a circular statistical graphic that is divided into slices to illustrate numerical proportions. Each slice of the pie represents a category's contribution to the whole, and the size of each slice is proportional to the quantity it represents. Key Features of a Pie Chart: Shape: Circular. Slices: Each section (or slice) represents a part of the total. Percentage or Value: Often labeled with percentages or exact values. Total: Represents 100% of the data set. When to Use a Pie Chart: To show relative proportions or percentages of a whole. To compare parts of a single data series. When you have a limited number of categories
- Optimiertes dotLottieEmpfohlen946.4 KB
Kleinste Dateigröße mit Unterstützung für Themes, State Machines und Interaktivität.
90% kleiner als Lottie JSON - dotLottie3.9 MB
Komprimierte Lottie-Animation, die Theming und State Machine unterstützt.
- Optimiertes Lottie JSON2.3 MB
Optimiertes JSON-Format für schnelleres Laden mit Standard-Lottie-Unterstützung.
74% kleiner als Lottie JSON - Lottie JSON8.9 MB
Standard-Lottie-Animationsformat mit breiter Kompatibilität über Tools und Plattformen hinweg.
Other export formats
Interaktionen & Plugins
Alle anzeigen


Kostenlos zu verwenden unter der Lottie Einfach Lizenz