
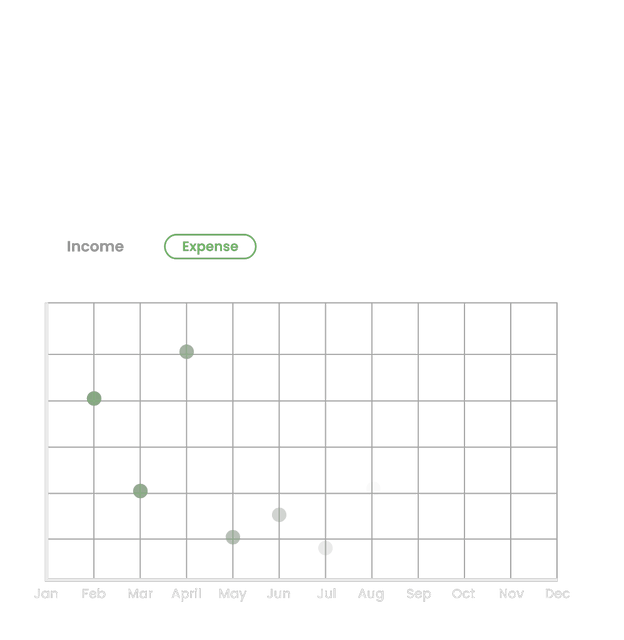
Free Interactive Finance Chart - Income and Expense Graph Animation
An interactive income and expense graph animation that switches between two charts on click and shows data points on hover. Perfect for finance dashboards, budgeting apps, and Fintech websites. Built with LottieFiles State Machines for realistic and responsive animation.
An interactive income and expense graph animation that switches between two charts on click and shows data points on hover. Perfect for finance dashboards, budgeting apps, and Fintech websites. Built with LottieFiles State Machines for realistic and responsive animation.
- Optimized dotLottieRecommended45.1 KB
Smallest file size with themes and interactivity.
87% smaller than Lottie JSON - dotLottie46.5 KB
Compressed, supports theming and states.
- Optimized Lottie JSON339 KB
Optimized JSON for faster loading.
4% smaller than Lottie JSON - Lottie JSON353 KB
Standard Lottie format, broad compatibility.
Other export formats
Interactions & plugins
View all


Free to use under the Lottie Simple License