
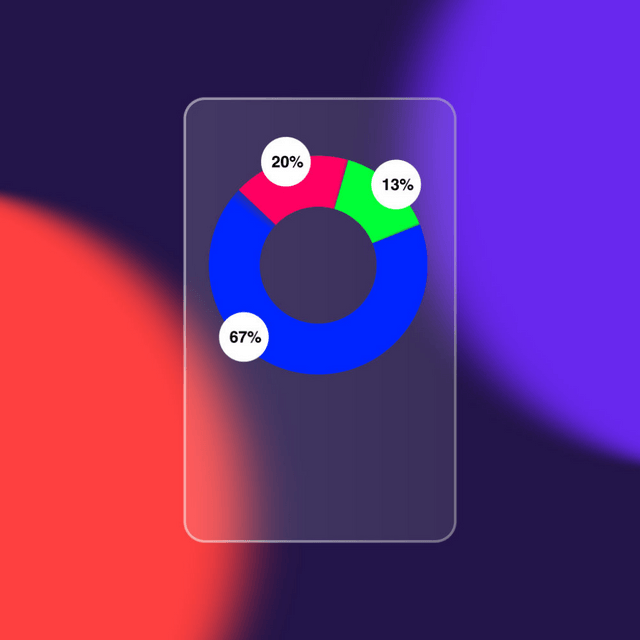
Free Pie Chart Glass Morphing Animation
A pie chart is a circular statistical graphic that is divided into slices to illustrate numerical proportions. Each slice of the pie represents a category's contribution to the whole, and the size of each slice is proportional to the quantity it represents. Key Features of a Pie Chart: Shape: Circular. Slices: Each section (or slice) represents a part of the total. Percentage or Value: Often labeled with percentages or exact values. Total: Represents 100% of the data set. When to Use a Pie Chart: To show relative proportions or percentages of a whole. To compare parts of a single data series. When you have a limited number of categories
A pie chart is a circular statistical graphic that is divided into slices to illustrate numerical proportions. Each slice of the pie represents a category's contribution to the whole, and the size of each slice is proportional to the quantity it represents. Key Features of a Pie Chart: Shape: Circular. Slices: Each section (or slice) represents a part of the total. Percentage or Value: Often labeled with percentages or exact values. Total: Represents 100% of the data set. When to Use a Pie Chart: To show relative proportions or percentages of a whole. To compare parts of a single data series. When you have a limited number of categories
- Optimized dotLottieRecommended946.4 KB
Smallest file size with themes and interactivity.
90% smaller than Lottie JSON - dotLottie3.9 MB
Compressed, supports theming and states.
- Optimized Lottie JSON2.3 MB
Optimized JSON for faster loading.
74% smaller than Lottie JSON - Lottie JSON8.9 MB
Standard Lottie format, broad compatibility.
Other export formats
Interactions & plugins
View all


Free to use under the Lottie Simple License