
無料Graph Animationアニメーション
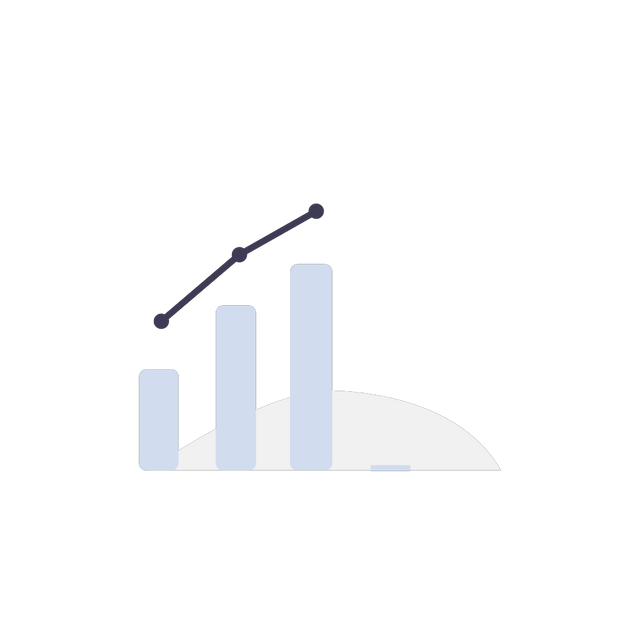
"Graph Animation" is a dynamic visual representation that transforms static data into a vibrant and engaging experience. Starting with a blank canvas, the animation introduces axes and gridlines, creating the framework for the graph. As data points materialize, a line or bars elegantly traverse the graph, illustrating trends and fluctuations over time or categories. The animation employs smooth transitions, highlighting key data points and emphasizing the evolving patterns. Colors, gradients, or other visual cues may be used to enhance clarity and make the information more accessible. This animated graph is not only informative but also visually appealing, making it an effective tool for presentations, educational content, or any context where conveying data trends is essential.
"Graph Animation" is a dynamic visual representation that transforms static data into a vibrant and engaging experience. Starting with a blank canvas, the animation introduces axes and gridlines, creating the framework for the graph. As data points materialize, a line or bars elegantly traverse the graph, illustrating trends and fluctuations over time or categories. The animation employs smooth transitions, highlighting key data points and emphasizing the evolving patterns. Colors, gradients, or other visual cues may be used to enhance clarity and make the information more accessible. This animated graph is not only informative but also visually appealing, making it an effective tool for presentations, educational content, or any context where conveying data trends is essential.
- 最適化 dotLottie推奨1.5 KB
テーマ、ステートマシン、インタラクティブ機能に対応した、最小ファイルサイズ。
Lottie JSON より 90% 小さい - dotLottie2.1 KB
テーマ設定とステートマシンに対応した、圧縮された Lottie アニメーション。
- 最適化 Lottie JSON10.6 KB
標準の Lottie に対応した、より高速に読み込める最適化済み JSON 形式。
Lottie JSON より 28% 小さい - Lottie JSON14.8 KB
幅広いツールやプラットフォームと互換性のある標準 Lottie アニメーション形式。
Other export formats
インタラクションとプラグイン
すべて表示


Lottieシンプルライセンスの下で無料で使用可能