
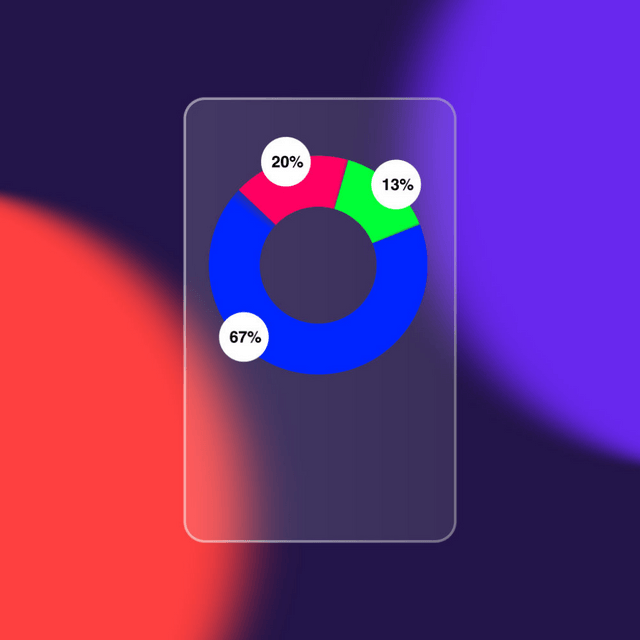
無料Pie Chart Glass Morphingアニメーション
A pie chart is a circular statistical graphic that is divided into slices to illustrate numerical proportions. Each slice of the pie represents a category's contribution to the whole, and the size of each slice is proportional to the quantity it represents. Key Features of a Pie Chart: Shape: Circular. Slices: Each section (or slice) represents a part of the total. Percentage or Value: Often labeled with percentages or exact values. Total: Represents 100% of the data set. When to Use a Pie Chart: To show relative proportions or percentages of a whole. To compare parts of a single data series. When you have a limited number of categories
A pie chart is a circular statistical graphic that is divided into slices to illustrate numerical proportions. Each slice of the pie represents a category's contribution to the whole, and the size of each slice is proportional to the quantity it represents. Key Features of a Pie Chart: Shape: Circular. Slices: Each section (or slice) represents a part of the total. Percentage or Value: Often labeled with percentages or exact values. Total: Represents 100% of the data set. When to Use a Pie Chart: To show relative proportions or percentages of a whole. To compare parts of a single data series. When you have a limited number of categories
- 最適化 dotLottie推奨946.4 KB
テーマ、ステートマシン、インタラクティブ機能に対応した、最小ファイルサイズ。
Lottie JSON より 90% 小さい - dotLottie3.9 MB
テーマ設定とステートマシンに対応した、圧縮された Lottie アニメーション。
- 最適化 Lottie JSON2.3 MB
標準の Lottie に対応した、より高速に読み込める最適化済み JSON 形式。
Lottie JSON より 74% 小さい - Lottie JSON8.9 MB
幅広いツールやプラットフォームと互換性のある標準 Lottie アニメーション形式。
Other export formats
インタラクションとプラグイン
すべて表示


Lottieシンプルライセンスの下で無料で使用可能