
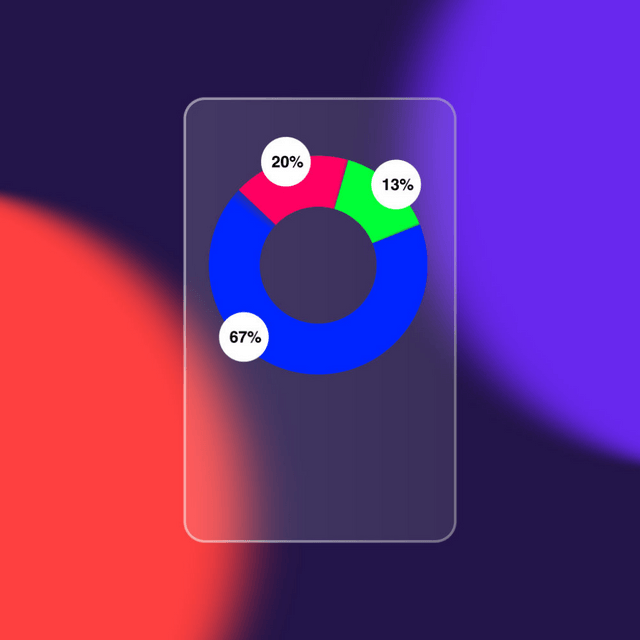
무료 Pie Chart Glass Morphing 애니메이션
A pie chart is a circular statistical graphic that is divided into slices to illustrate numerical proportions. Each slice of the pie represents a category's contribution to the whole, and the size of each slice is proportional to the quantity it represents. Key Features of a Pie Chart: Shape: Circular. Slices: Each section (or slice) represents a part of the total. Percentage or Value: Often labeled with percentages or exact values. Total: Represents 100% of the data set. When to Use a Pie Chart: To show relative proportions or percentages of a whole. To compare parts of a single data series. When you have a limited number of categories
A pie chart is a circular statistical graphic that is divided into slices to illustrate numerical proportions. Each slice of the pie represents a category's contribution to the whole, and the size of each slice is proportional to the quantity it represents. Key Features of a Pie Chart: Shape: Circular. Slices: Each section (or slice) represents a part of the total. Percentage or Value: Often labeled with percentages or exact values. Total: Represents 100% of the data set. When to Use a Pie Chart: To show relative proportions or percentages of a whole. To compare parts of a single data series. When you have a limited number of categories
- 최적화된 dotLottie추천946.4 KB
테마, 스테이트 머신 및 인터랙티브 기능을 지원하는 가장 작은 파일 크기입니다.
Lottie JSON보다 90% 더 작음 - dotLottie3.9 MB
테마와 스테이트 머신을 지원하는 압축된 Lottie 애니메이션입니다.
- 최적화된 Lottie JSON2.3 MB
표준 Lottie 지원과 함께 더 빠른 로딩을 위해 최적화된 JSON 형식입니다.
Lottie JSON보다 74% 더 작음 - Lottie JSON8.9 MB
다양한 도구 및 플랫폼에서 폭넓은 호환성을 제공하는 표준 Lottie 애니메이션 형식입니다.
Other export formats
상호작용 및 플러그인
모두 보기


Lottie 간단 라이선스 하에 무료 사용 가능